How synthetic data helps wheat detectors work on fields they've never seen
On familiar fields, real photos almost always beat synthetic data. On a new country, a new camera, a new growing season, that flips. We tested it on the Global Wheat Head Detection benchmark.
A wheat head detector trained for one farm rarely keeps its accuracy when it ships to the next. Different soil, different cameras, different growth stages, different weather. The training set never saw any of it, and the model pays for it.
Synthetic data is built for exactly this problem. You can render fields from any region, any sensor, any time of day, and the labels come for free. So we ran a controlled test on the Global Wheat Head Detection benchmark, a dataset stitched together from research stations across France, Switzerland, the UK, and Canada. We trained on France and tested on Canada and the UK, then asked a simple question: how does synthetic data hold up when the test set is genuinely new ground?
The short version. On familiar fields, real photos almost always win. On unfamiliar ones, synthetic data is one of the most valuable training signals you can add. And mixing synthetic with real beats either source alone, even when you triple the real budget.
The question we're answering
For agricultural object detection, the cost asymmetry is severe. A real, labeled wheat field image might take 20 to 40 minutes to annotate. A simulator can generate thousands per hour, with pixel-perfect labels for free. The catch is the sim-to-real gap. Models trained on synthetic data often look great on synthetic and stumble on real fields, especially when those fields look nothing like what the simulator approximated.
So we isolated three sources and tested them against each other:
Real. Annotated photographs from the GWHD dataset, the gold standard.
Synthetic. Procedurally rendered fields from our engine, with bounding boxes derived directly from the 3D scene.
GenAI. Synthetic images run through an image-to-image diffusion model. The prompts shift lighting, weather, and atmosphere while preserving plant geometry, so the original bounding boxes still apply. Cheap visual variety on top of perfect labels.
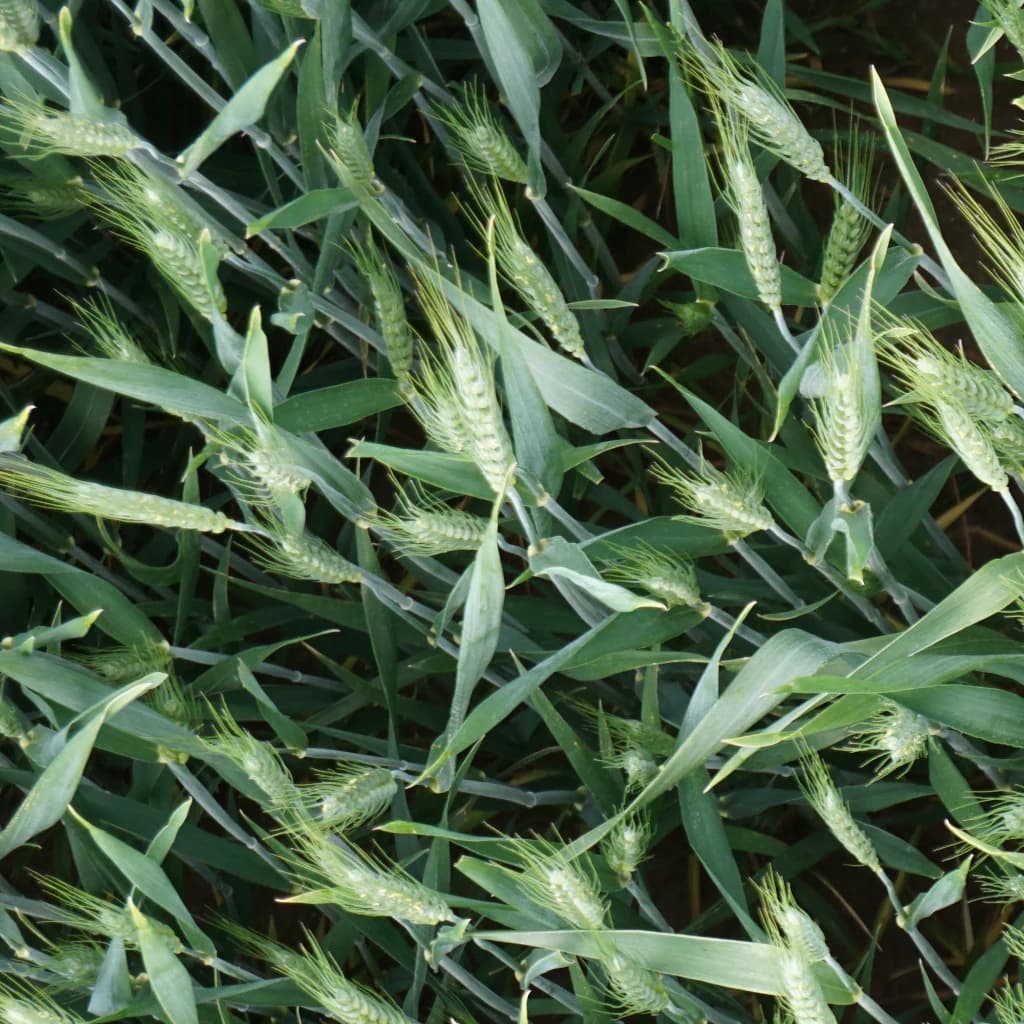
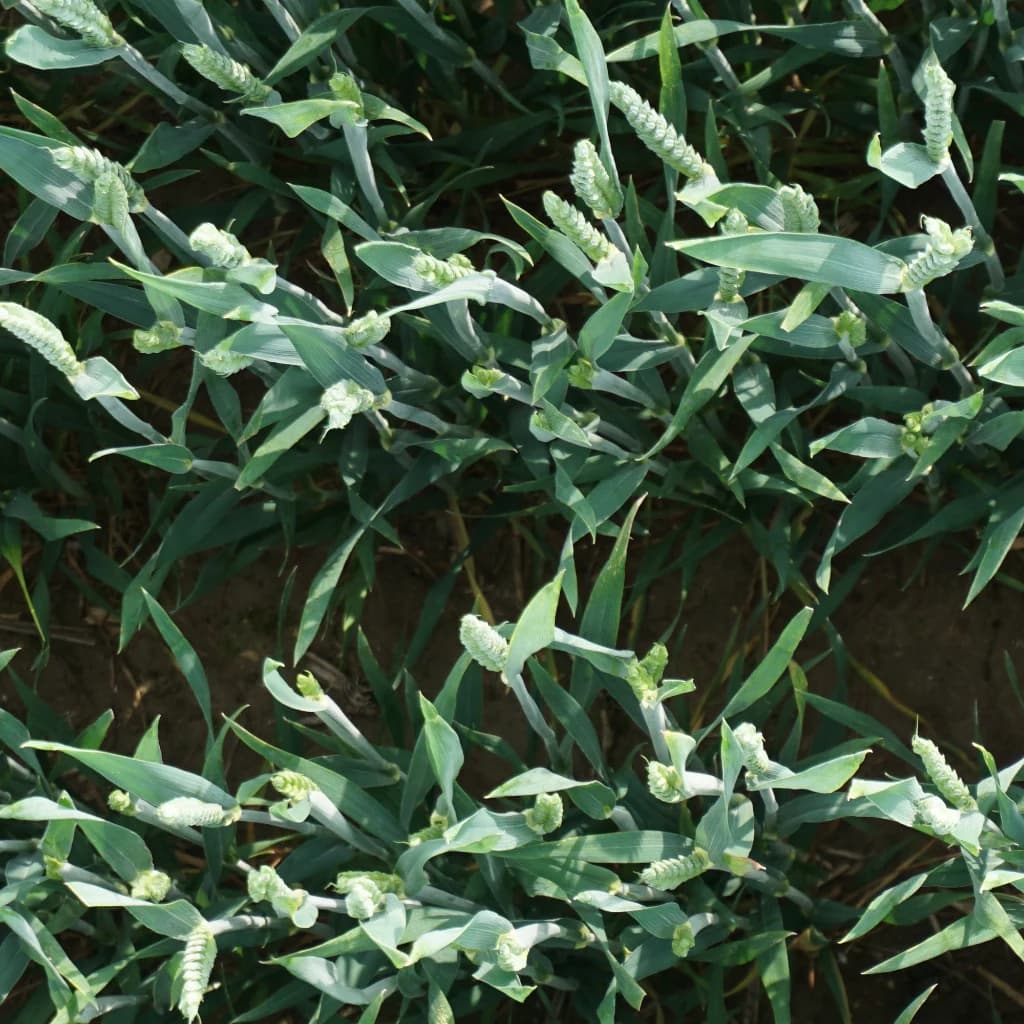
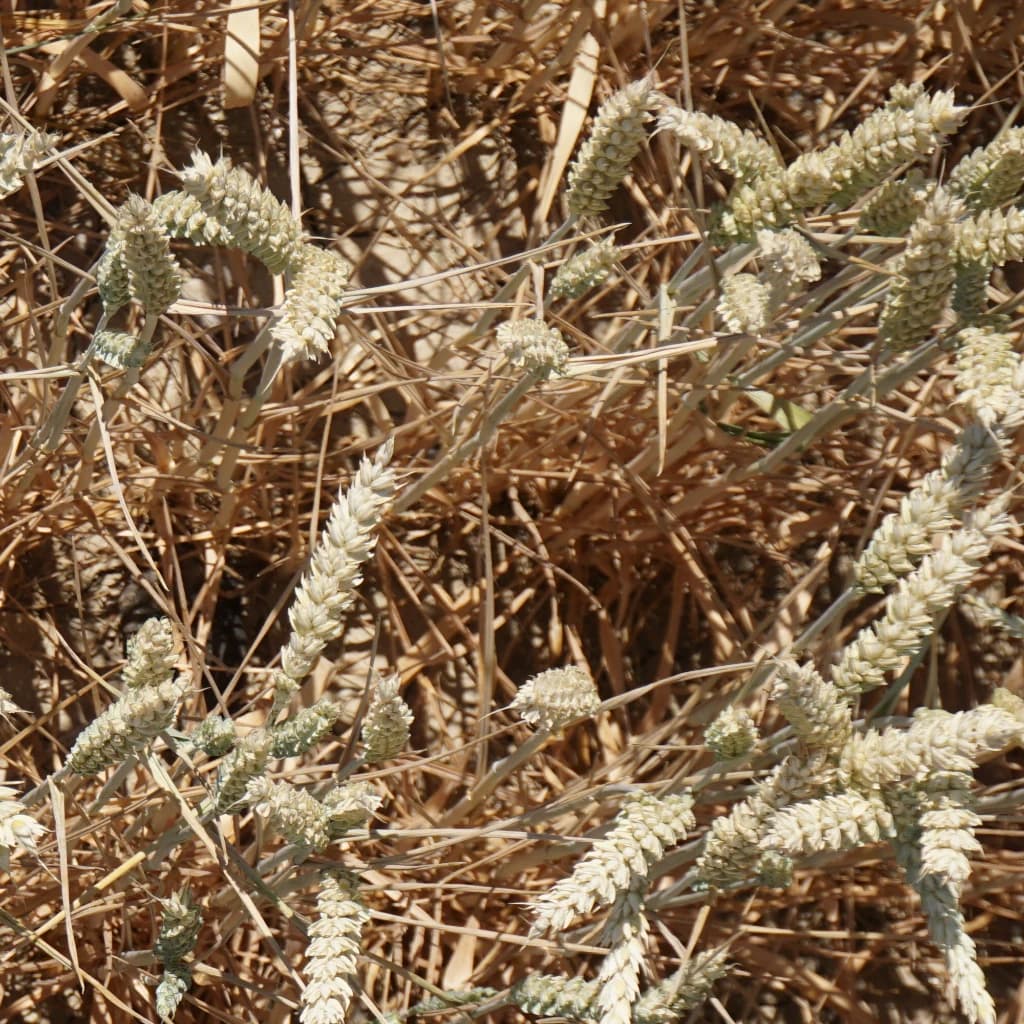
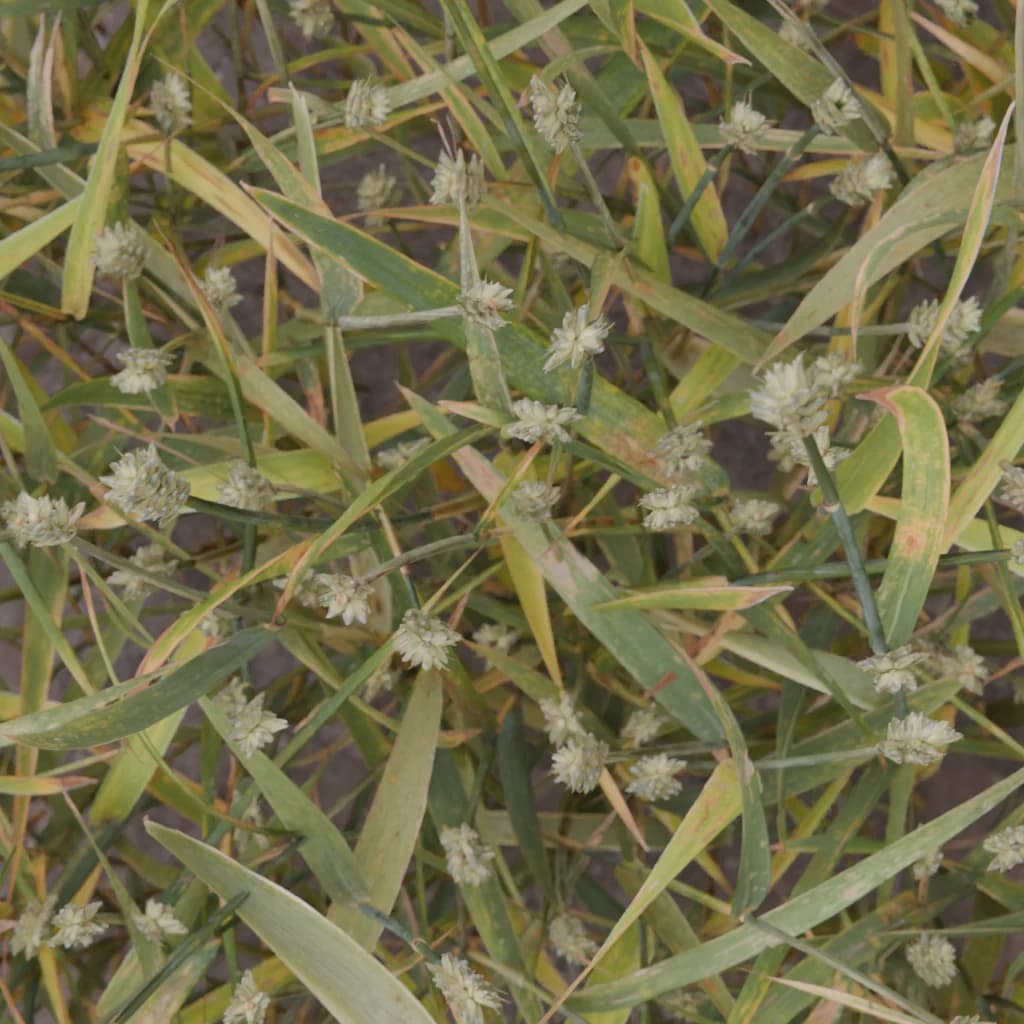
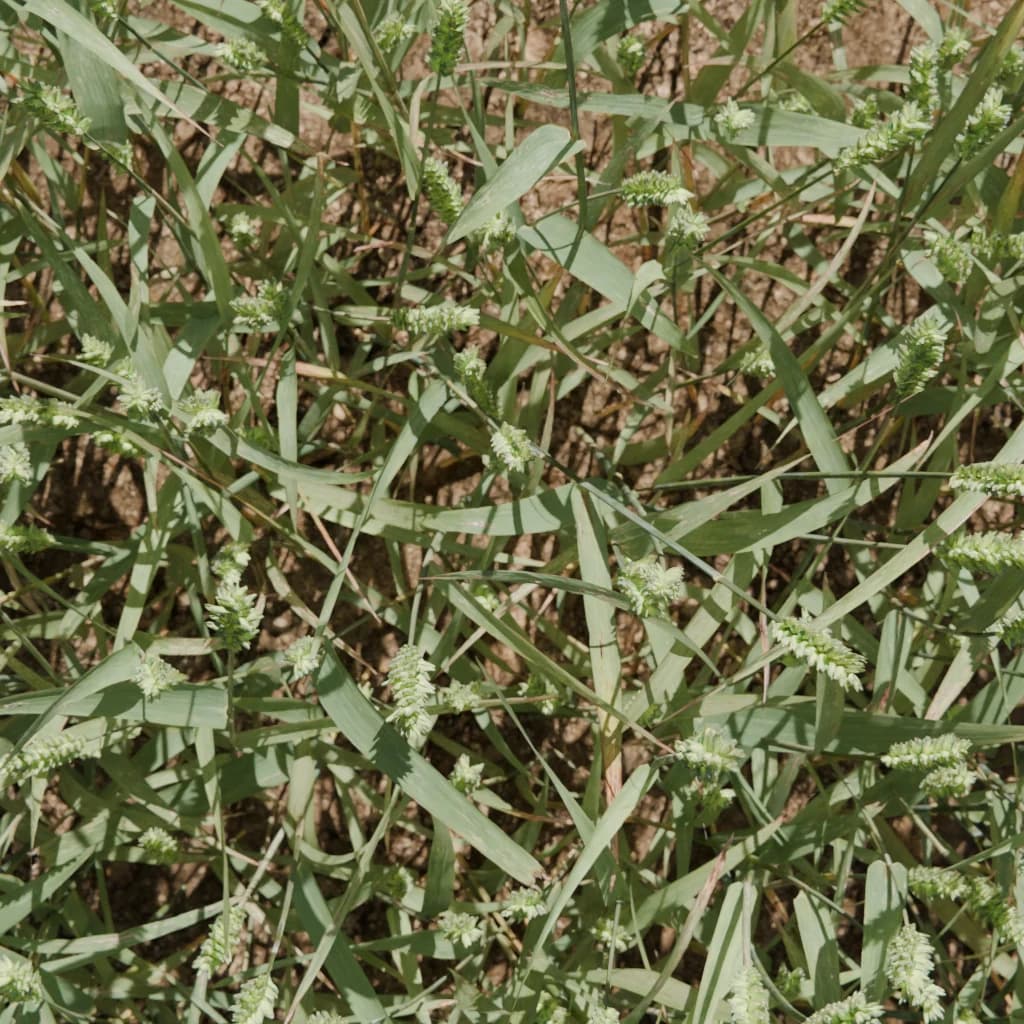
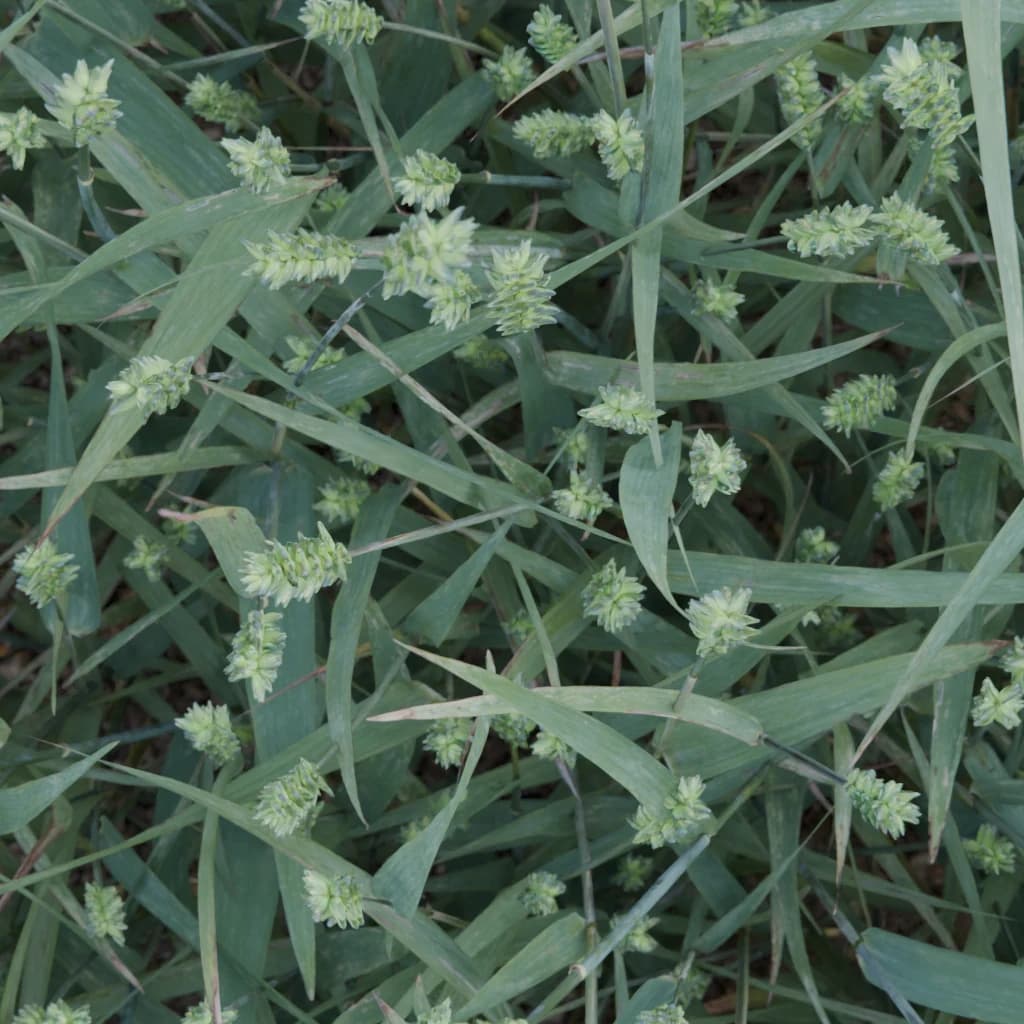
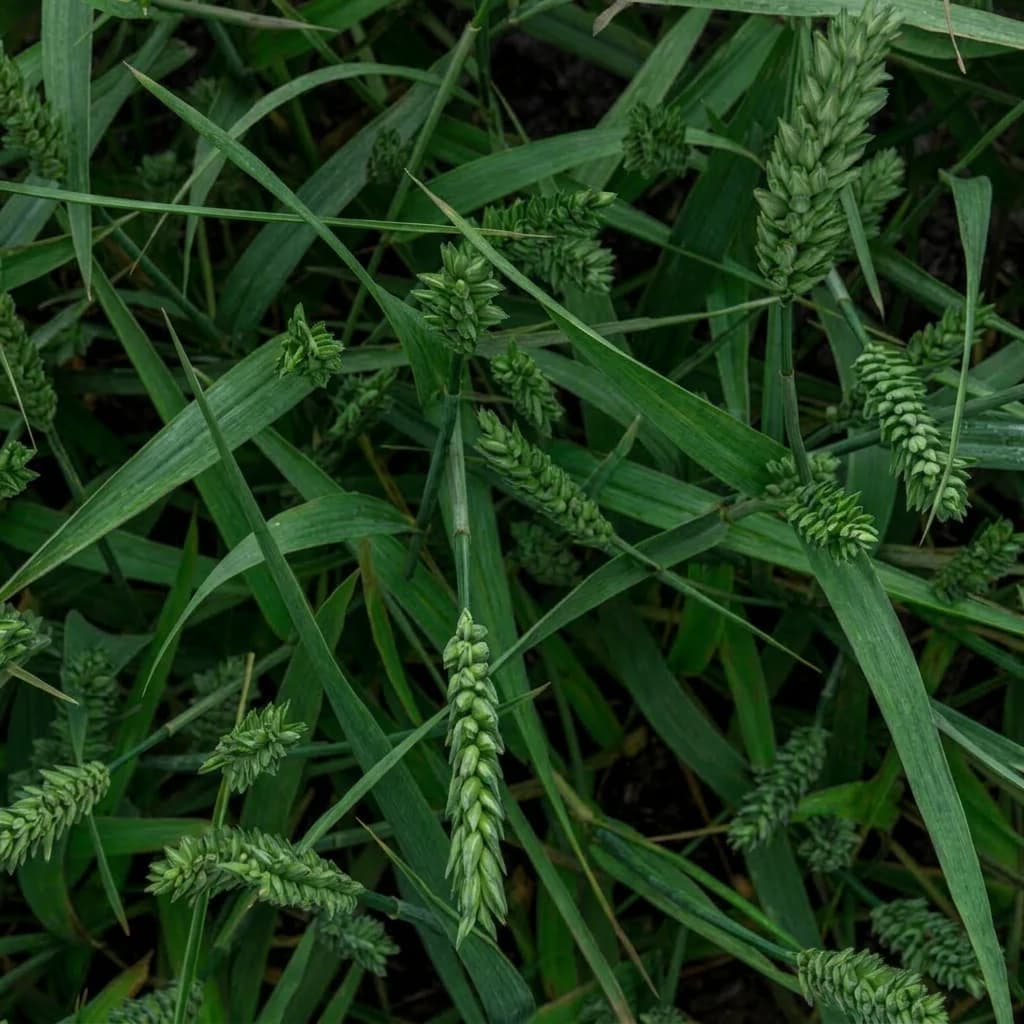
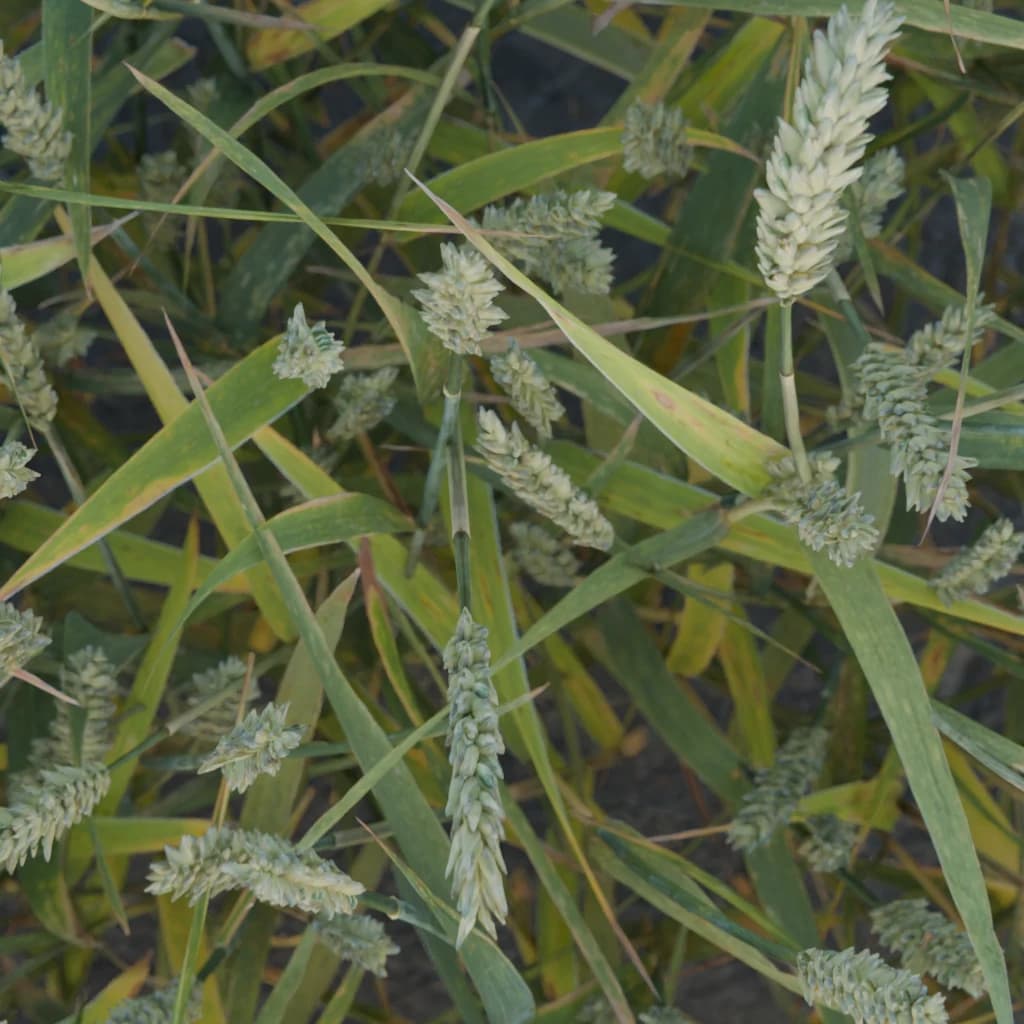
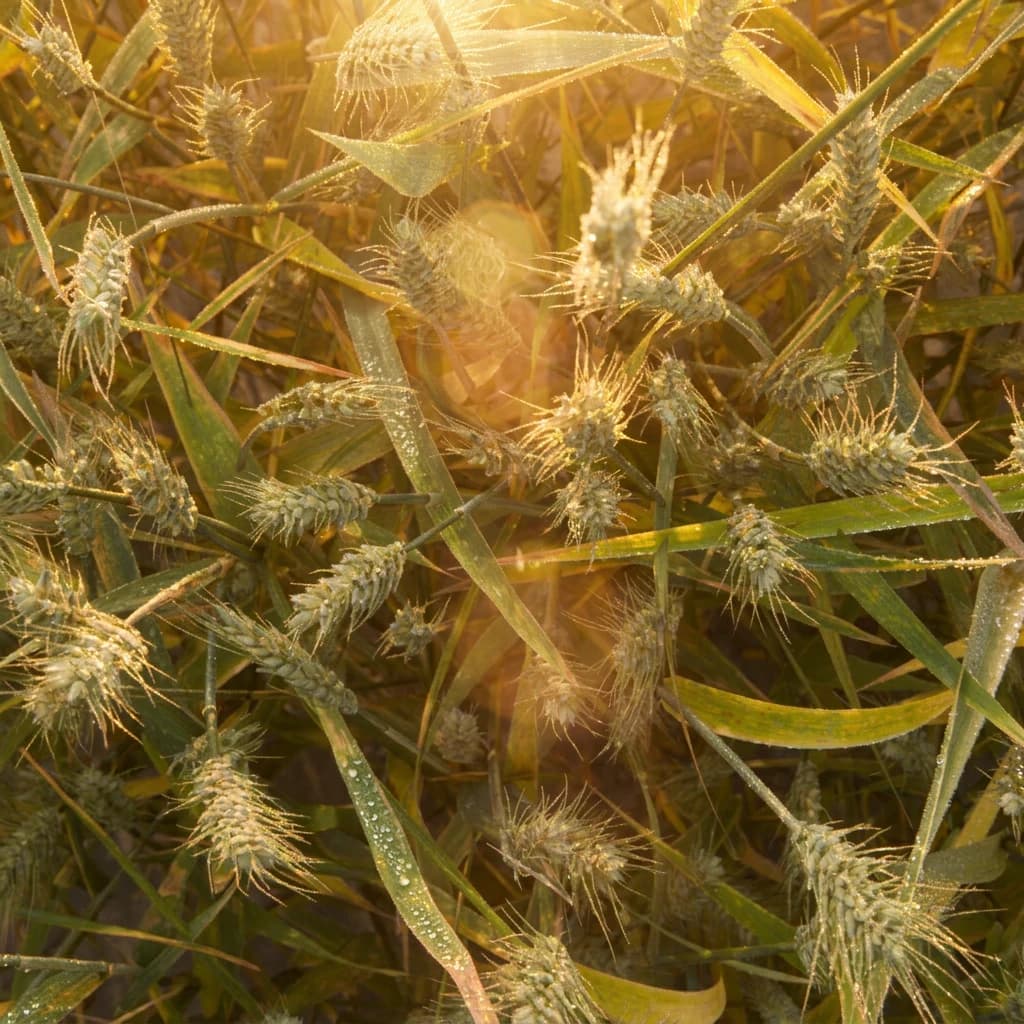
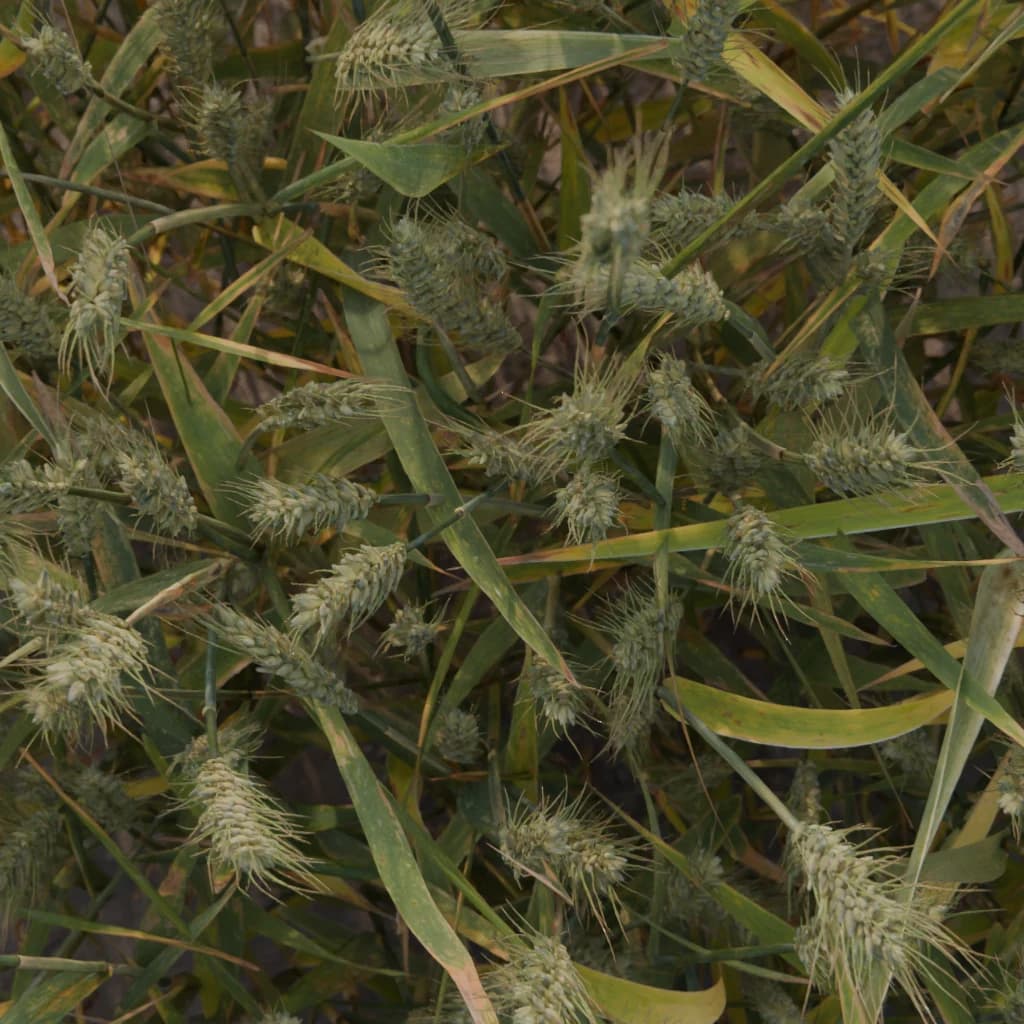
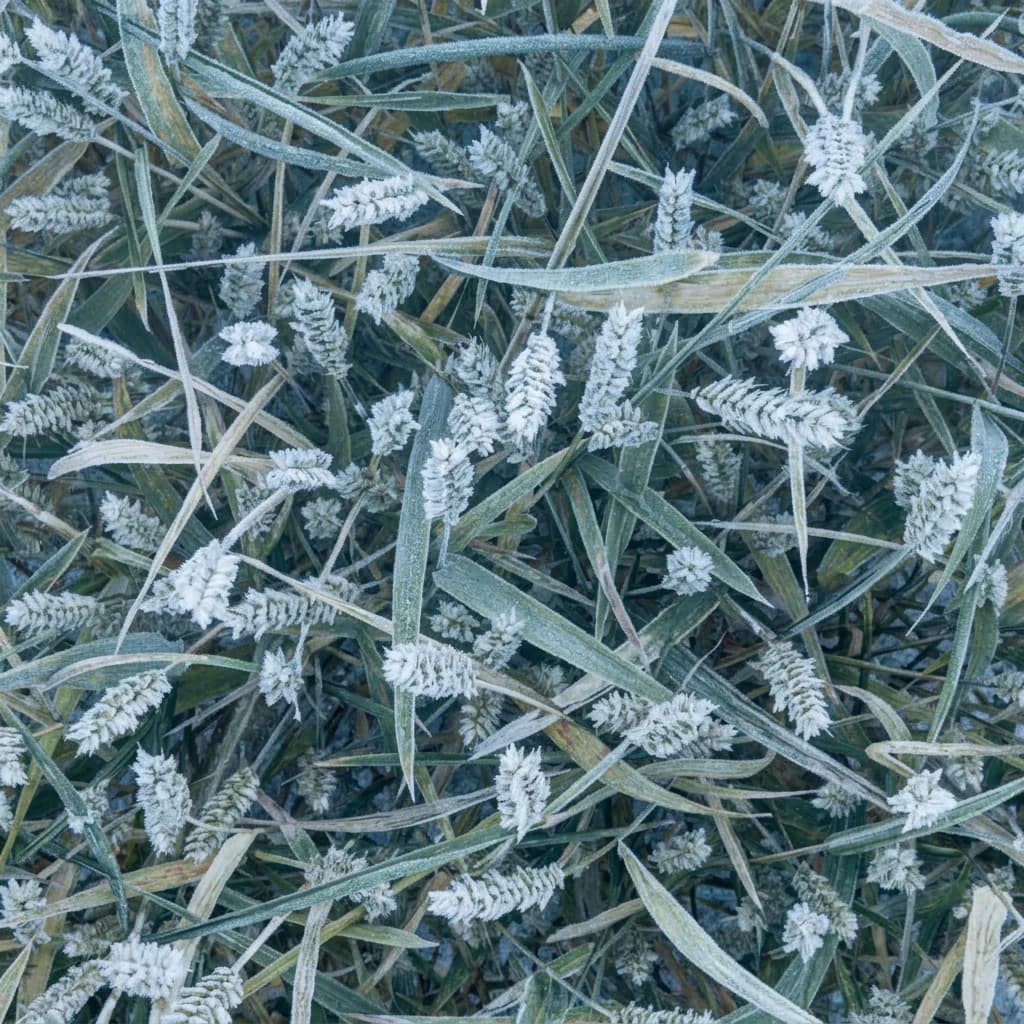
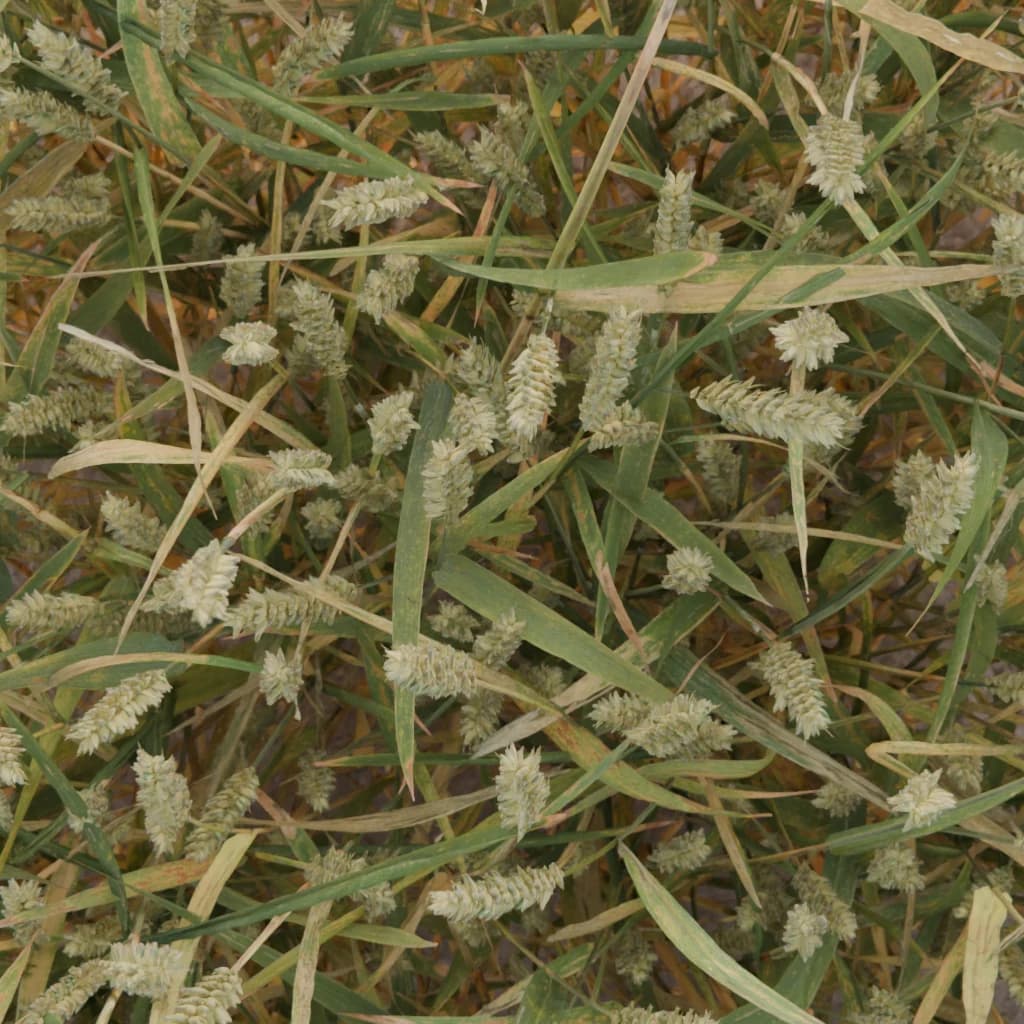
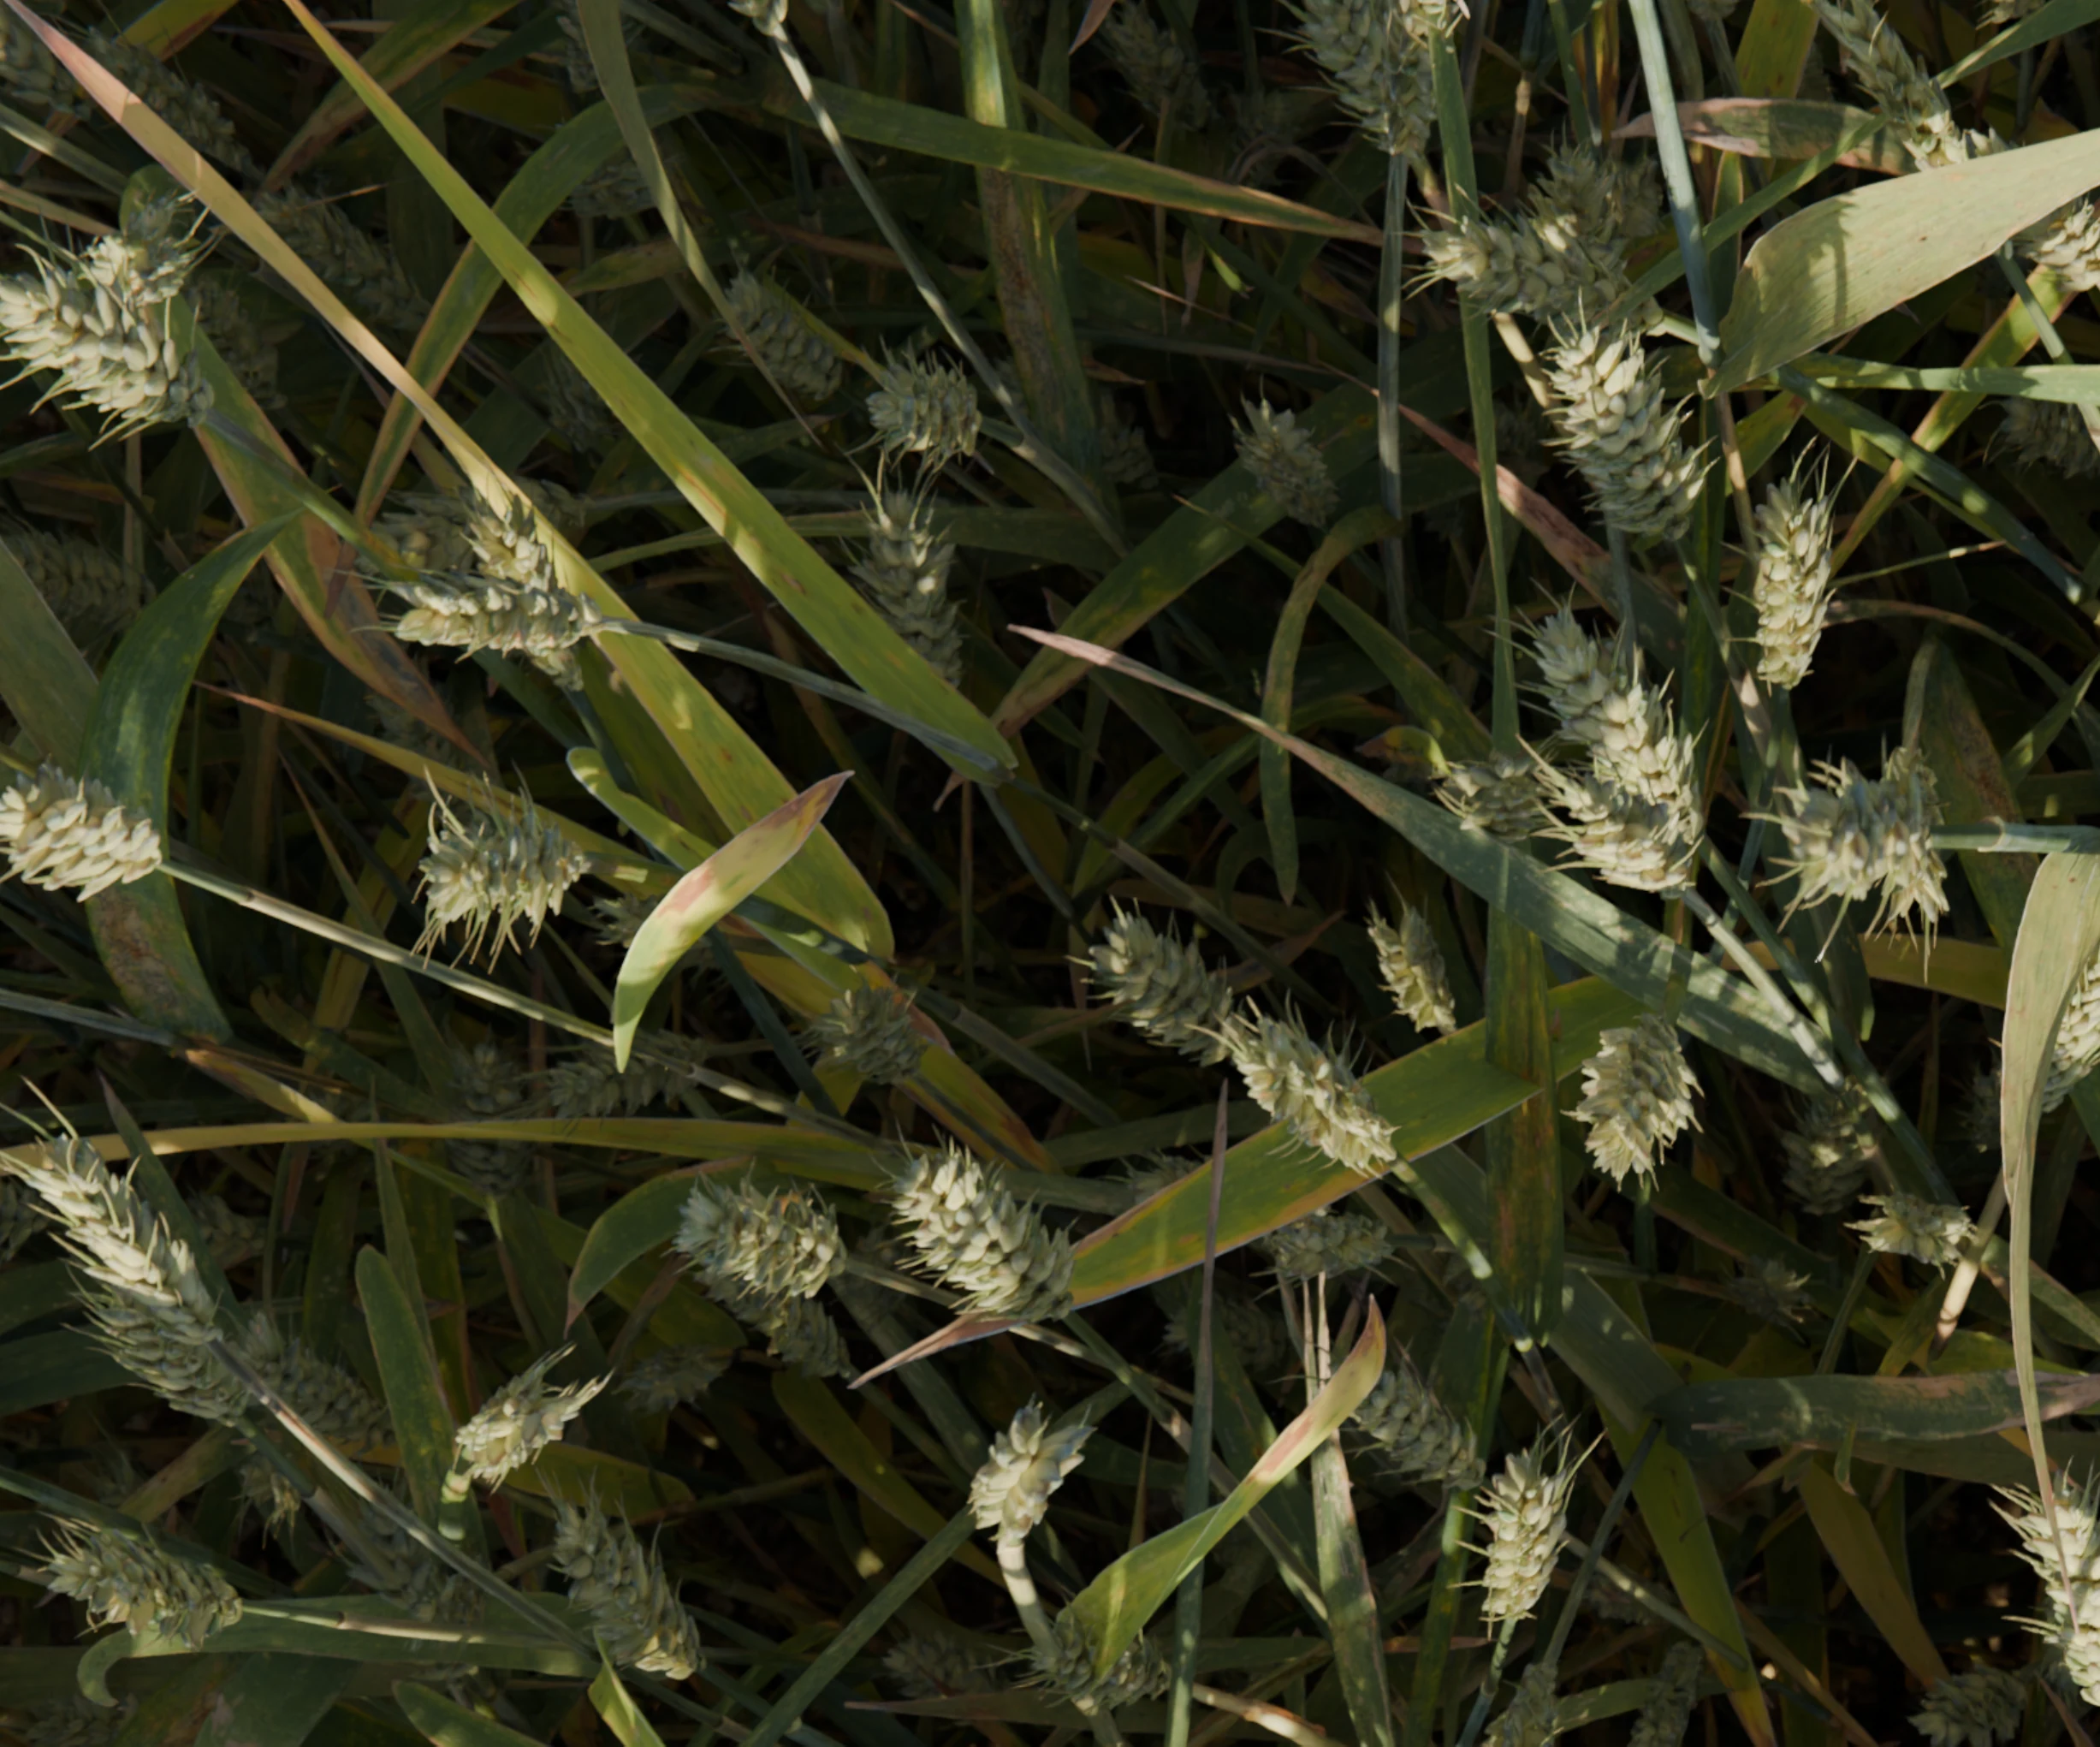
Qualitative examples
A model's mistakes track appearance. Here are representative training images across the three sources. Simulator renders are clearly synthetic, real GWHD photos look like real photos, and the GenAI variants take the simulator output and push it toward atmospheric and lighting conditions you would struggle to capture on demand with a real camera.
The setup
GWHD isn't really one dataset. It's a benchmark stitched together from research institutes in several countries, each capturing wheat with different cameras, in different climates, at different growth stages. That's exactly the kind of variation that matters when a detector ships to a new farm.
A random train/test split would let the model memorize a research station and still look brilliant on the test set. So we split by source instead. Training images come from France, validation from Switzerland, and the test set from Canada and the UK. Every reported number below is the model's score on cameras, conditions, and growing seasons it never saw during training.
| Split | Domains | Images | Annotations |
|---|---|---|---|
| Testheld out throughout | usask_1, rres_1 (Canada + UK) | 632 | 25,195 |
| Validation | ethz_1 (Switzerland) | 747 | 49,603 |
| Train pool | arvalis_1/2/3, inrae_1 (France) | 2,043 | 70,613 |
Every result in this post is evaluated on the same 632 Canadian and British images, captured by cameras, in light, and at growth stages the model never saw during training. The simulator and GenAI sets are training-only; they never touch validation or test.
Model: YOLO26-m (Ultralytics 8.4.19) at 640px, batch 16, RTX 5090. We report mAP@50 and the harder mAP@50–95.
Results
1. Matched-budget comparison
We start with a matched-budget comparison: fix the training budget to 701 images and vary only the data source. This isolates the image-for-image contribution of each source under identical training and evaluation settings.
A 50/50 mix of synthetic and real beats either source alone, at the same total budget.
Three things stand out here. Pure synthetic trails real by about 2.4 mAP@50, the measurable sim-to-real gap that the rest of the experiments are trying to close. GenAI restyling closes roughly 60% of that gap without any new labels: same simulated scenes, same bounding boxes, more visual diversity coming through the image-to-image model. And most importantly, a 50/50 mix of synthetic and real beats both pure sources at the same total budget. The two sources teach the model genuinely different things, and the model gets more out of having both.
2. Does more real data win?
A natural follow-up question. If the sim-to-real gap is real, does throwing more real data at the problem just close it? We trained on the full 2,000-image real training pool and compared it to the 701-image mixed configuration.
| Configuration | Images | mAP@50 | mAP@50-95 |
|---|---|---|---|
| Real only | 2,000 | 0.9299 | 0.5225 |
| Real only | 701 | 0.9164 | 0.5292 |
| Mix (synth + real)350 / 351 | 701 | 0.9335 | 0.5184 |
701 mixed images beat 2,000 real images on mAP@50, and effectively tie on the harder mAP@50-95. Past a threshold, the diversity of training imagery matters more than the raw count. This is the finding with the clearest operational impact: substantial annotation effort avoided without a meaningful loss in performance.
3. Stacking everything
The headline configuration. Real, synthetic, and GenAI together.
GenAI restyling widens the visual distribution the network sees during training. Different lighting, different weather, different atmospheric conditions, layered on top of an already strong real-plus-synthetic foundation. Same labels, more diversity, better generalization.
What we learned
Synthetic alone is close, but not quite there.
0.89 vs 0.92 mAP@50 at the same image budget. The sim-to-real gap is real, and worth treating explicitly when you plan a dataset.
Mixing 50/50 beats either source, and beats nearly 3× as much real data.
This is the headline. Synthetic and real teach the model different things, and together they're genuinely synergistic.
GenAI restyling is cheap appearance diversity.
Same labels, more visual variety, measurable gains on top of pure-synthetic and mixed baselines. Roughly 60% of the sim-to-real gap closed for the cost of a few hundred image-to-image inference calls.
The best recipe is all three.
Real anchors realism. Synthetic adds geometric and labeling precision at scale. GenAI broadens the appearance distribution. Together: 0.937 mAP@50 on countries the model has never trained on.
Beyond bounding boxes
This study measured object detection. That is one of many tasks synthetic data can support. Because every render is a fully described 3D scene, any label that depends on geometry, materials, or scene metadata can be exported from the same pipeline at no extra cost.
The annotations below all come from the same rendered frame. The same scene, at the same instant, produces every label type simultaneously — none required manual labeling.
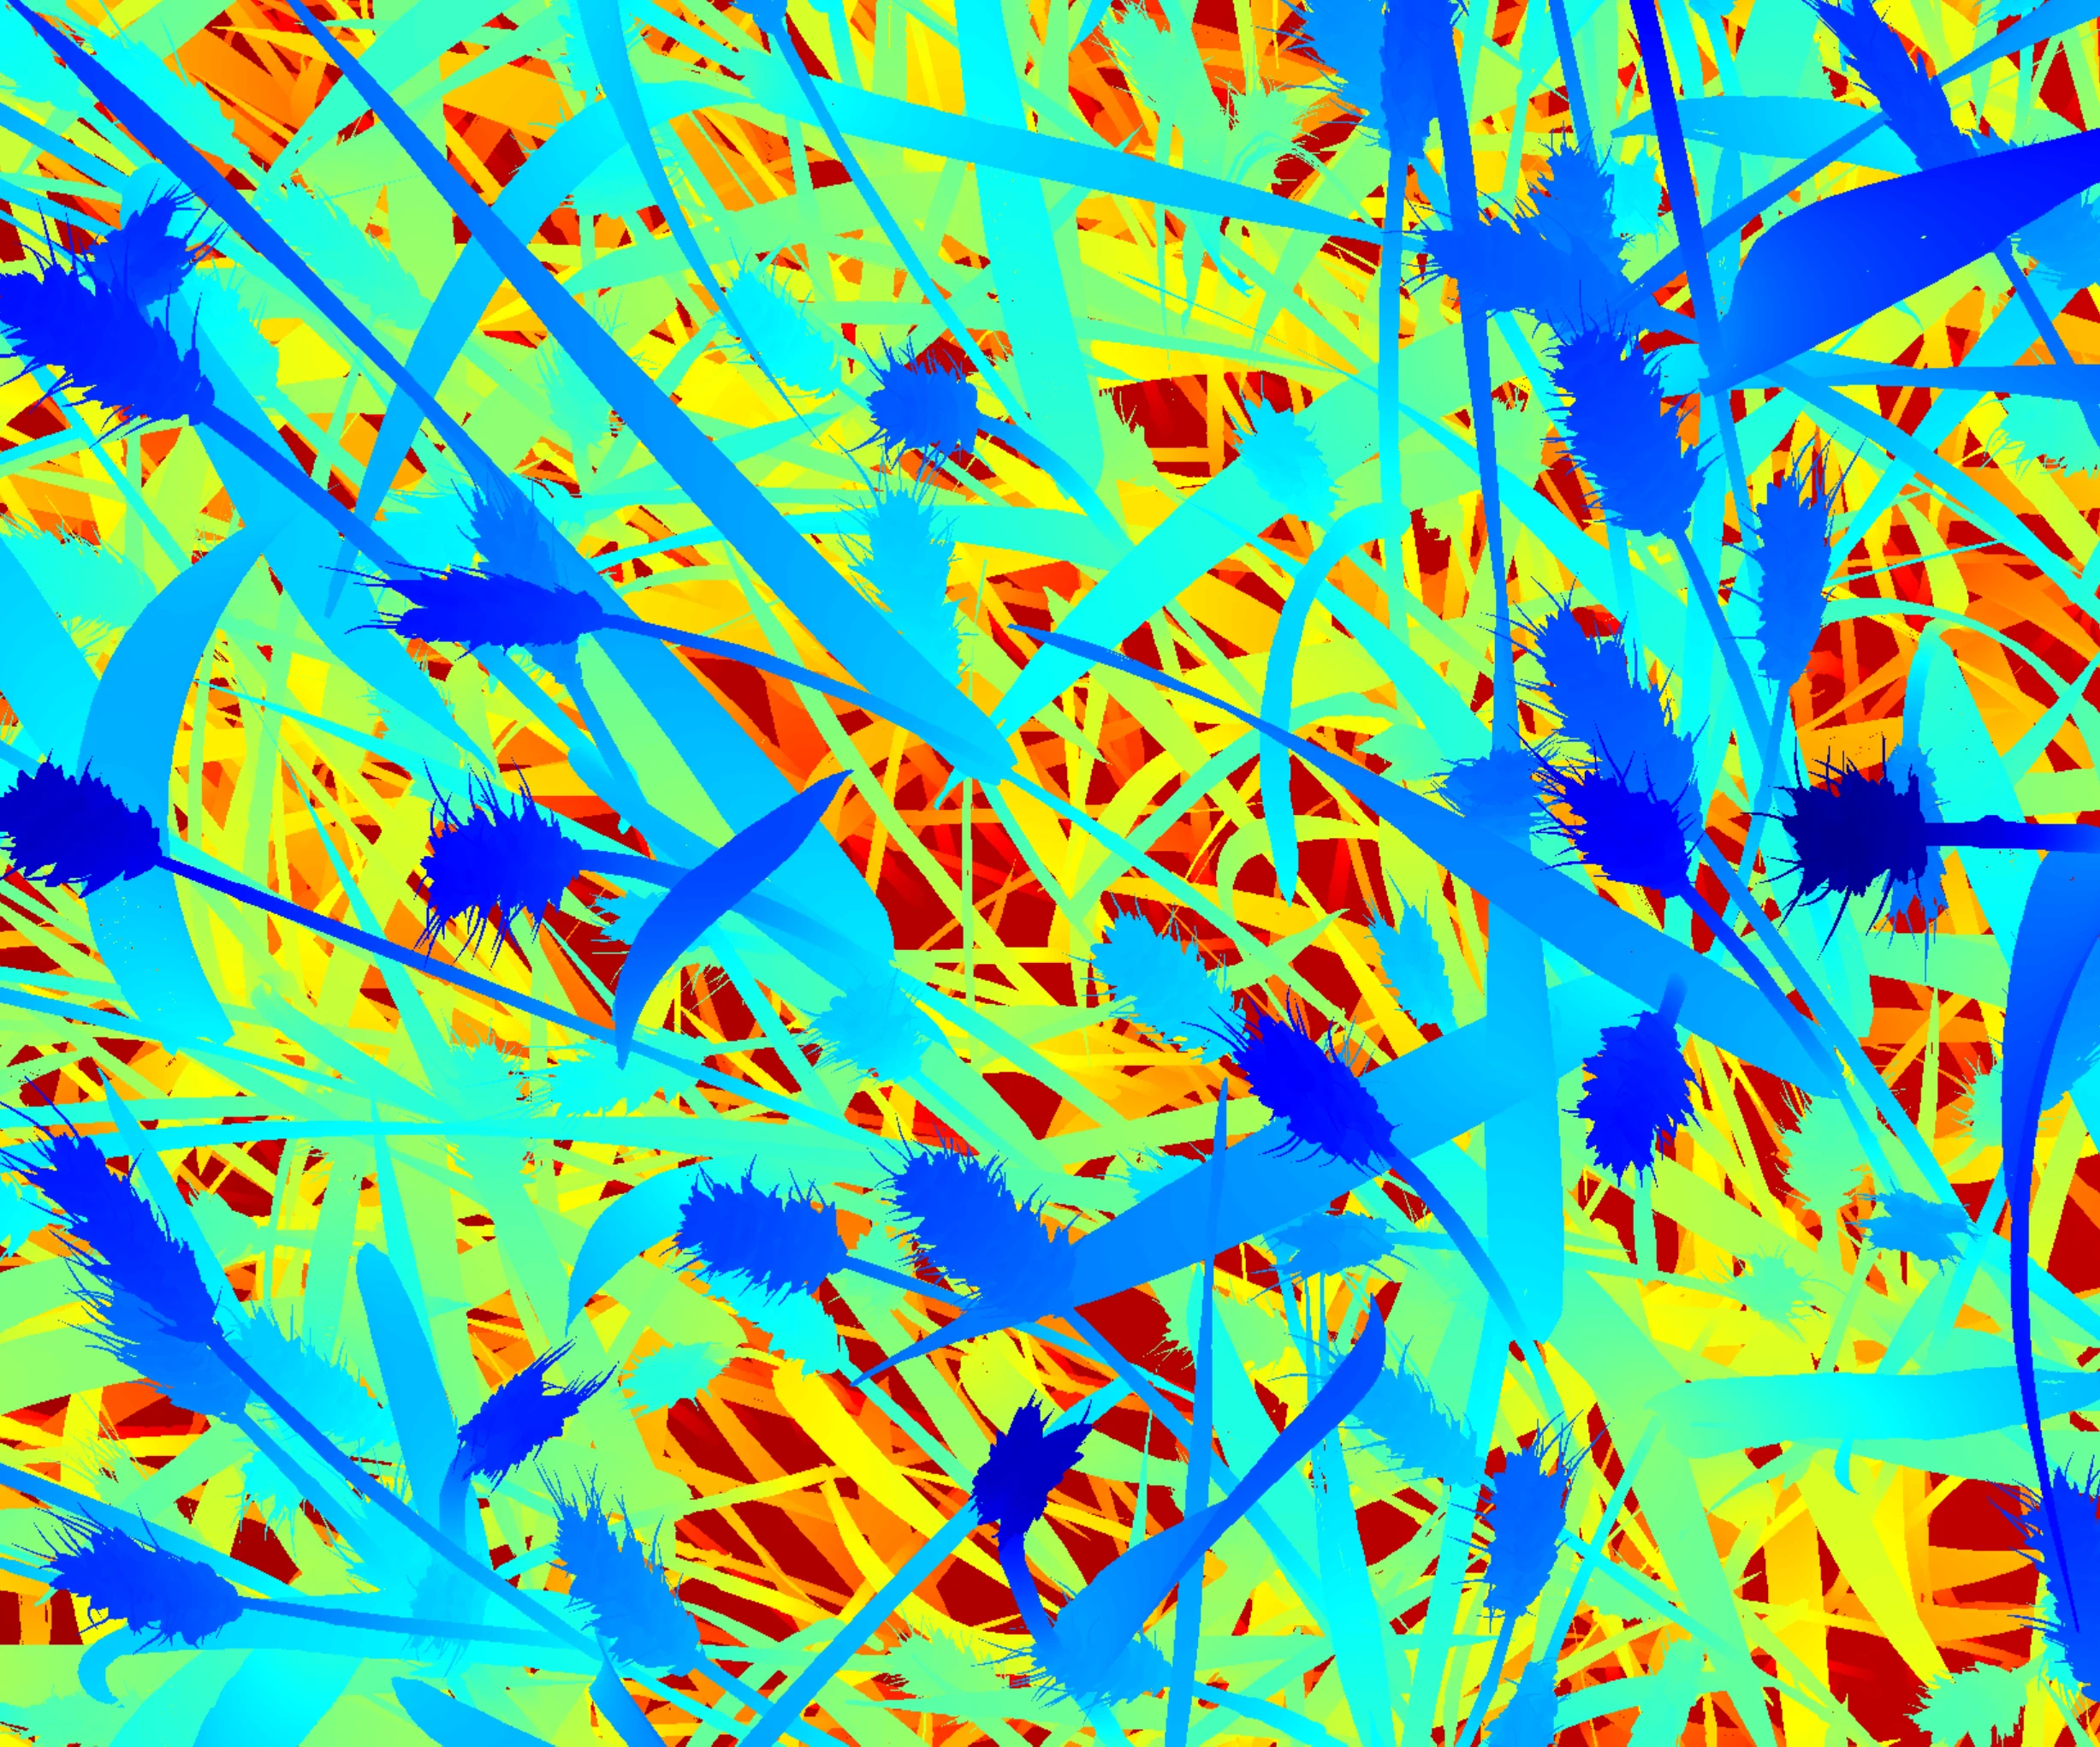
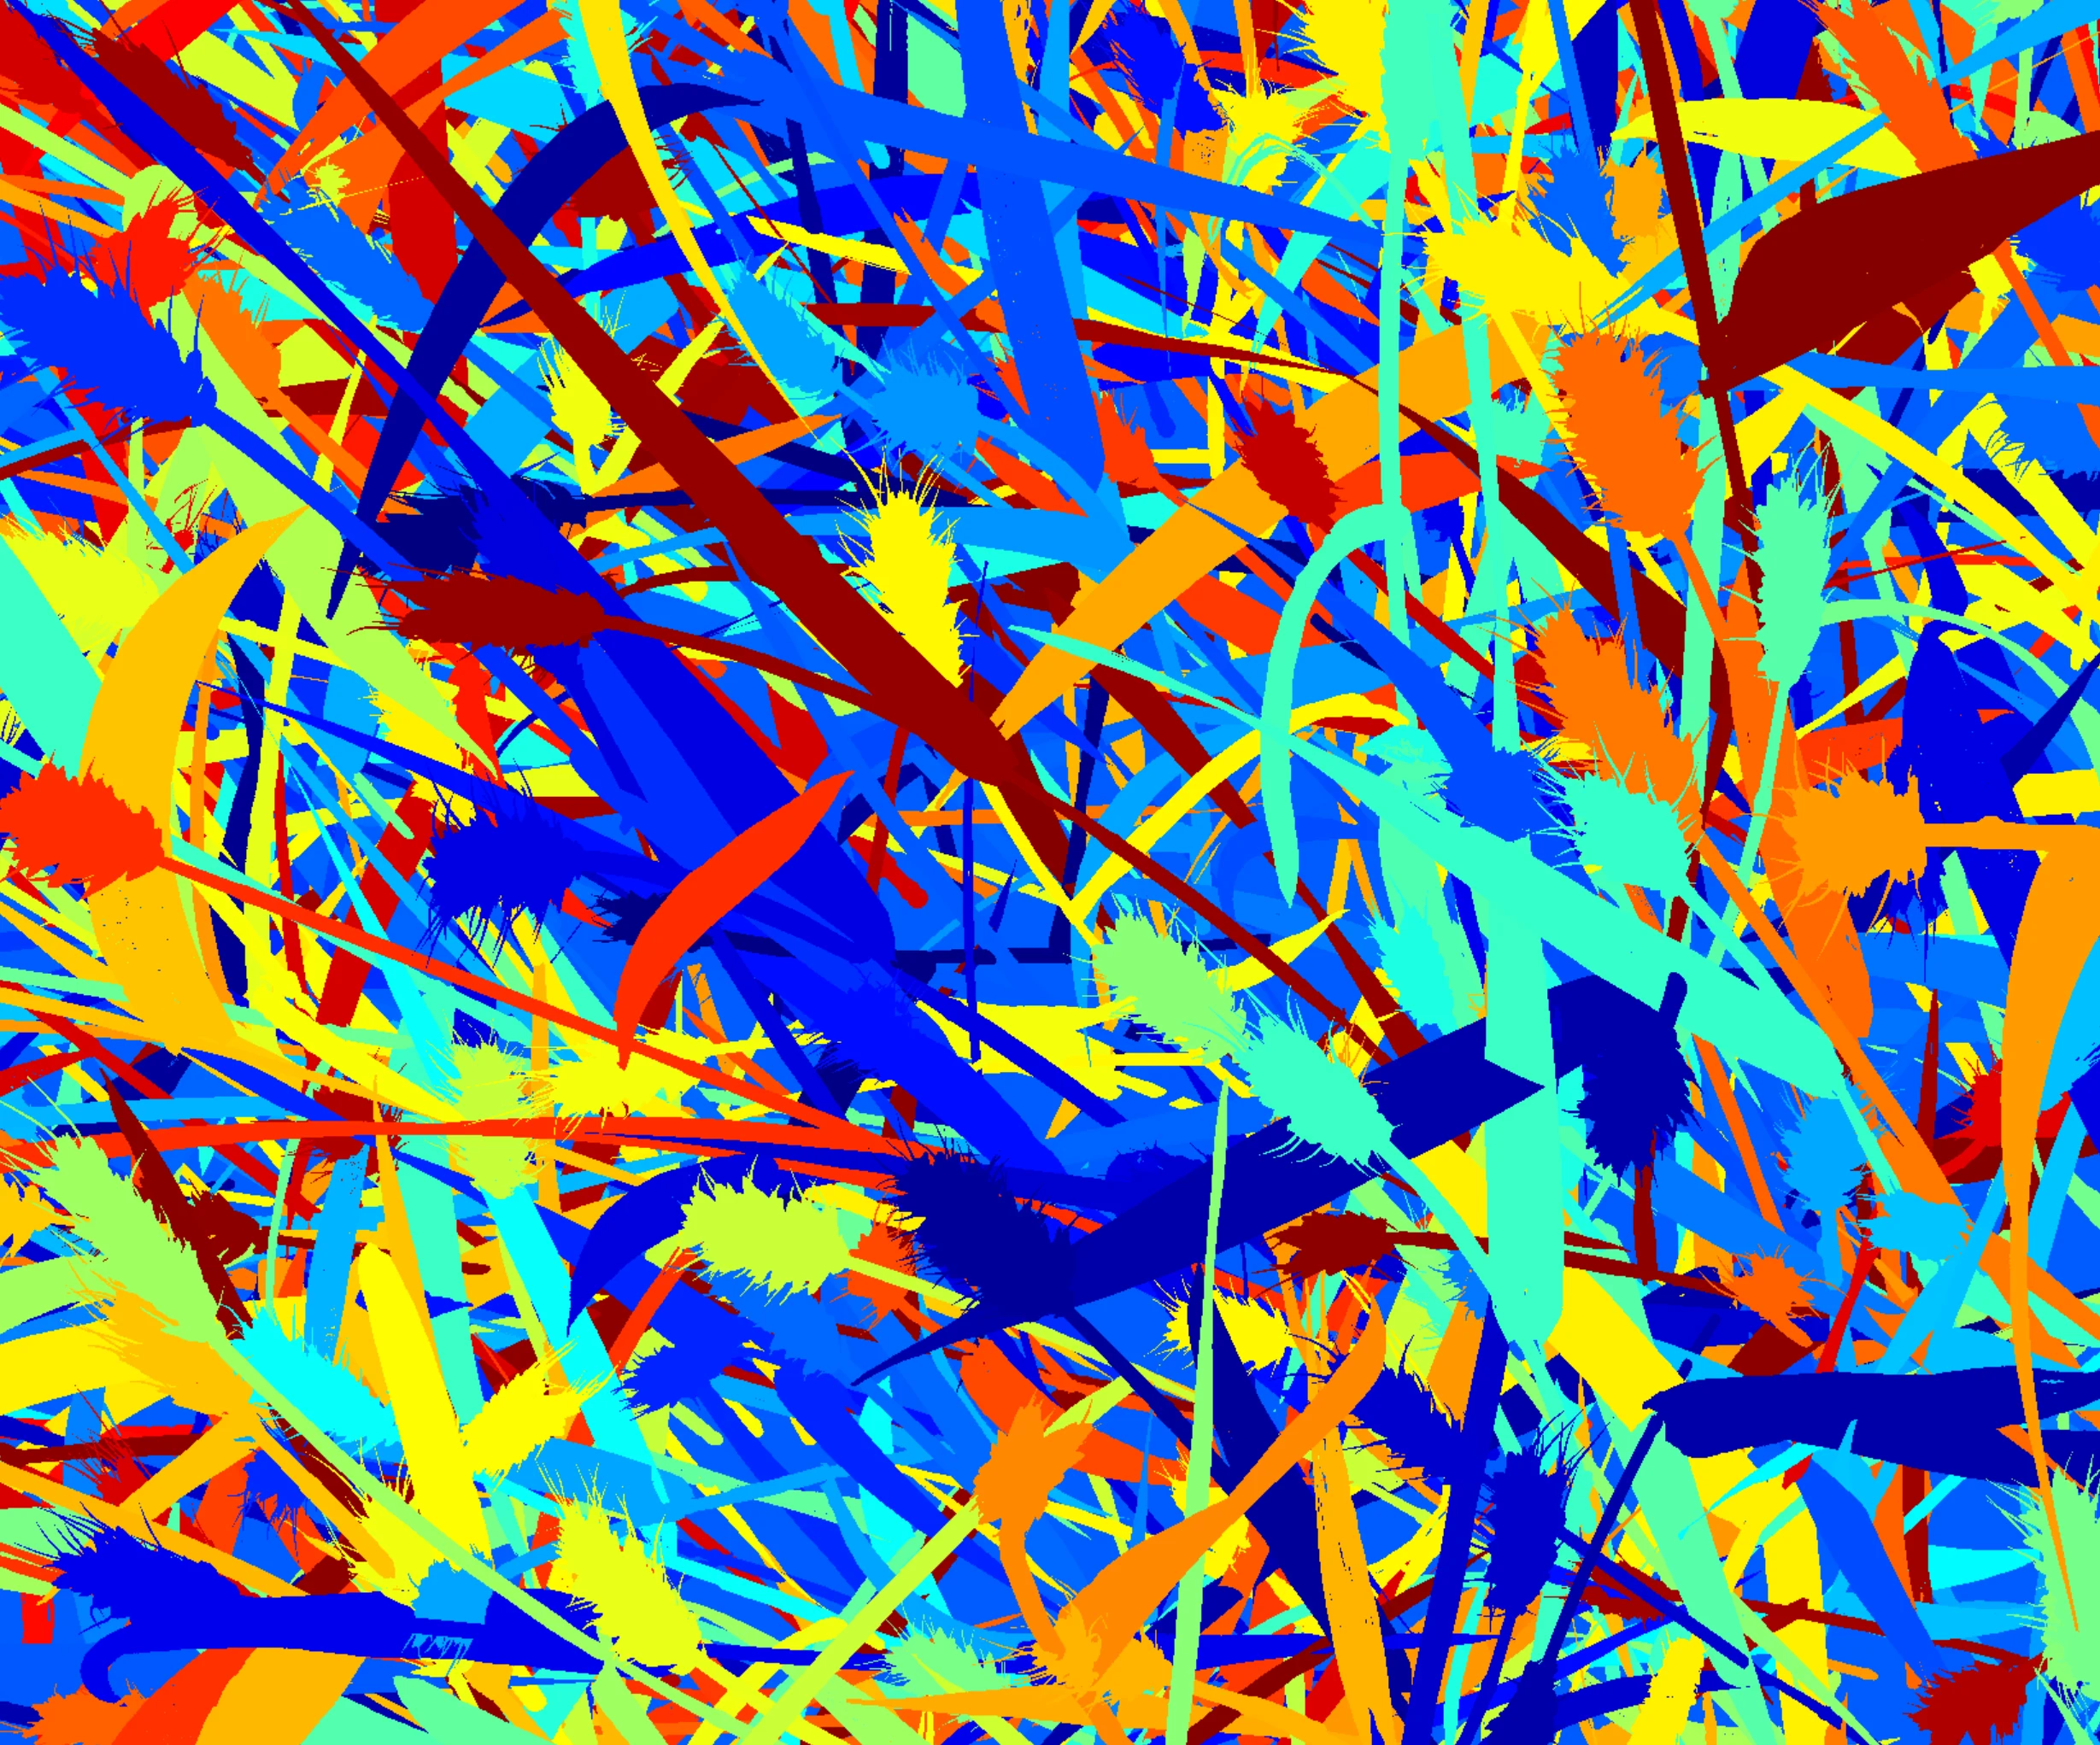
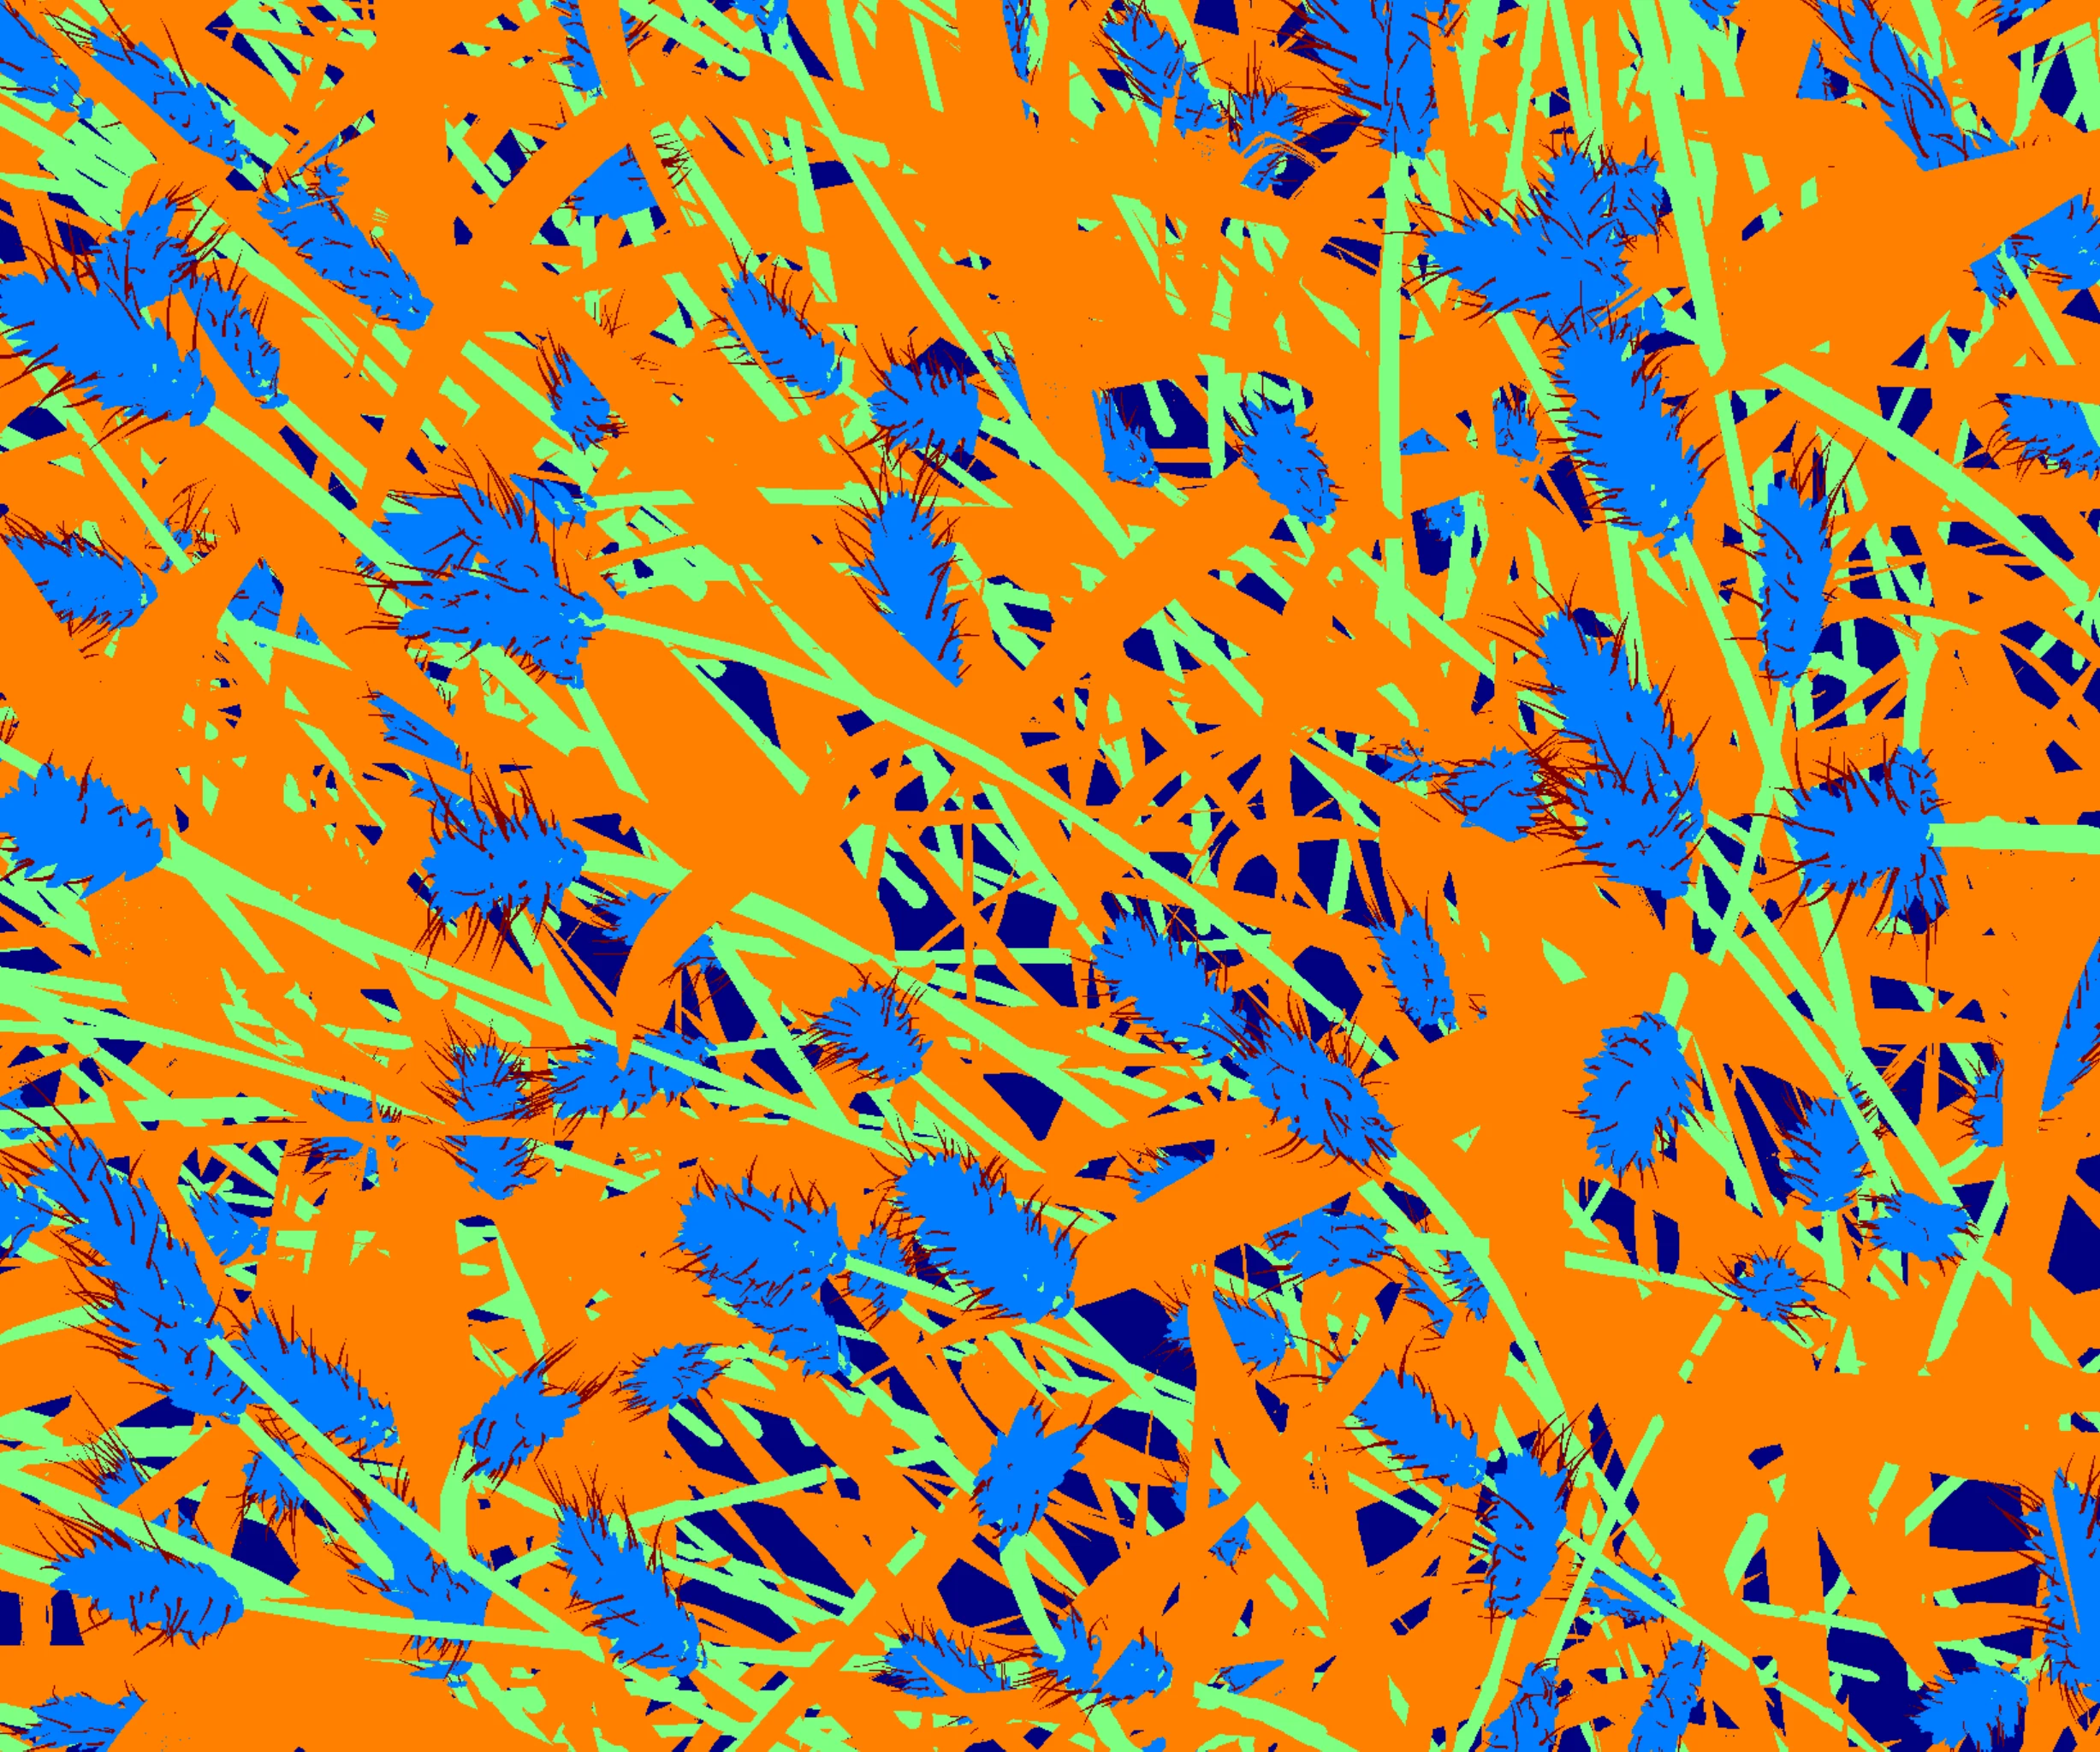
Bounding boxes are what we benchmarked. Most downstream systems need more than that. Synthetic data lets you change the task without rebuilding the dataset.
Building detection models for the field?
If annotation is slowing you down, we can help. Simmetry generates simulator-grade synthetic datasets for crops and field operations, with consistent labels and controllable variability, so you can train and iterate faster without giving up evaluation rigor.
usask_1 plus rres_1 (632 images, 25,195 annotations). Validation: ethz_1. Model: YOLO26-m, 640px, batch 16. Synthetic bounding boxes derived from instance masks intersected with the wheat_parts semantic mask. GenAI augmentations produced via image-to-image diffusion with prompts spanning lighting, weather, and atmosphere; prompts explicitly preserve plant geometry so original labels remain valid. All experiments evaluated on the same held-out test set.